 Postozo
Client reports that send themselves
Pick a customer and a period. Postozo puts their posts and each network's numbers on 1 page you can share as a link, save as a PDF, or have emailed every week or month.
What you can do
1 page per client
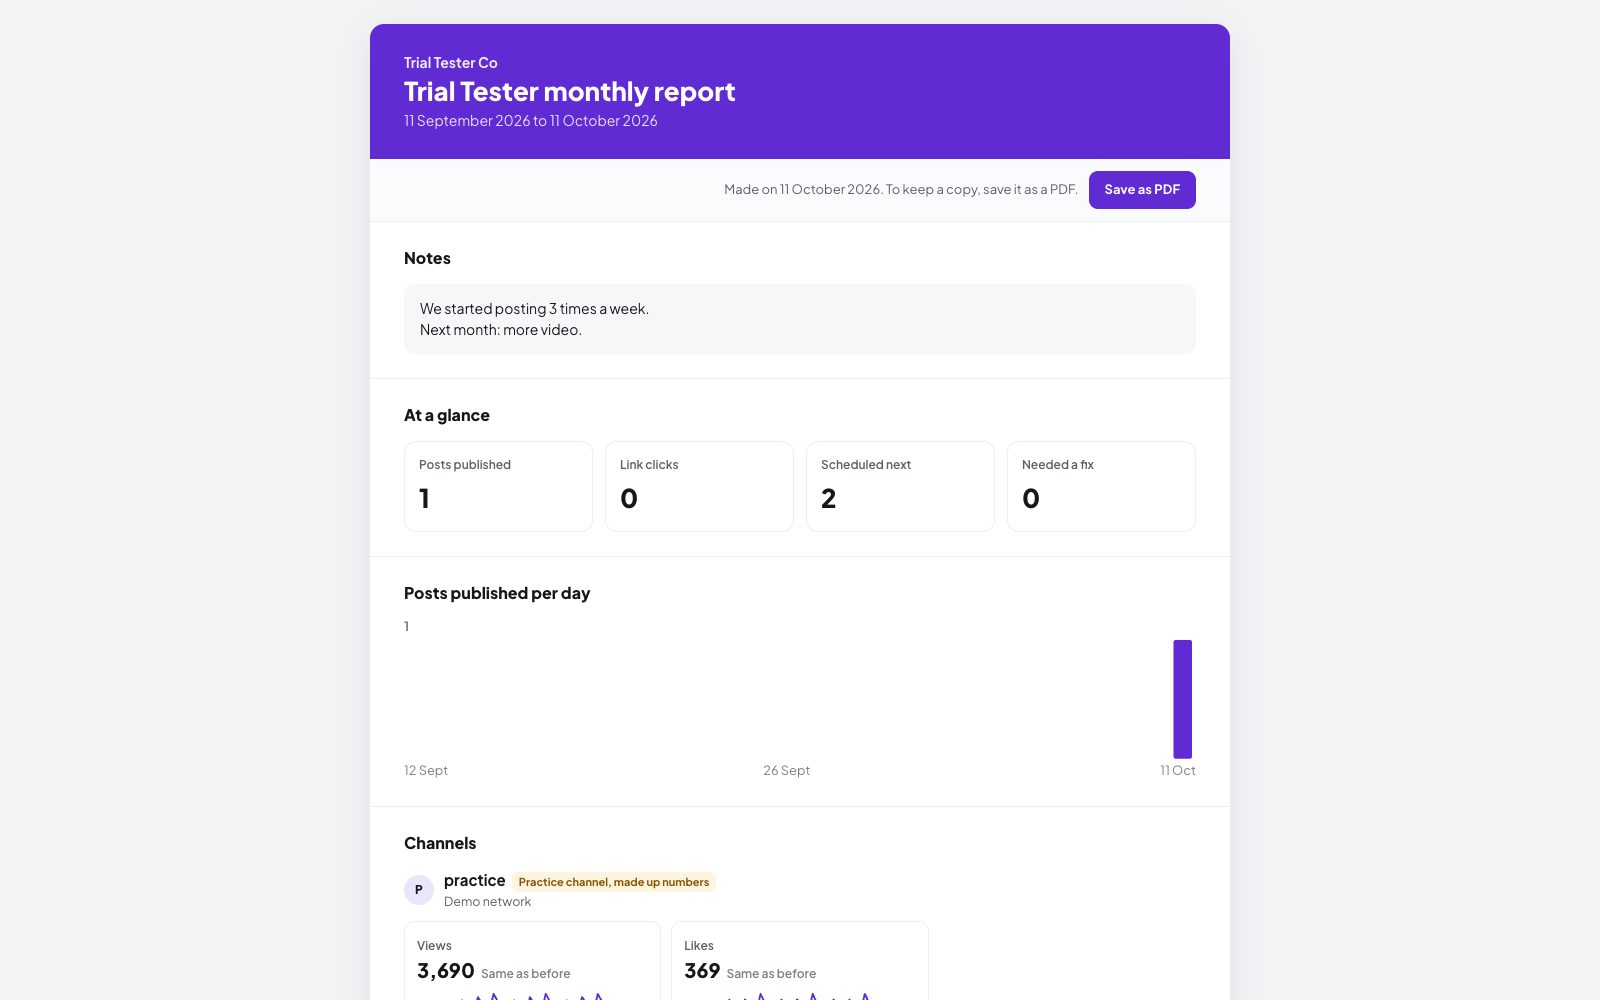
Totals, a posts per day chart, each channel's numbers and the top posts, for 7, 30 or 90 days.
Share a link
Send a link that always shows the newest report. The client needs no account.
Save as a PDF
Open the report and press Save as PDF. It is laid out for A4 paper.
Emailed on a schedule
Weekly or monthly, at the hour you pick in the report's own time zone, to up to 10 people.
Your brand on it
With white label, the report shows your agency name, logo and colour instead of ours.
Numbers that do not change
Each report keeps a copy of its numbers, so an old link or email shows exactly what was sent.
Send client social media reports in 4 steps
Create a report
Open Reports, give it a name and pick the customer. Leave the channel list empty to include every channel of that customer, also ones you add later.
Choose what to show
Pick the period (7, 30 or 90 days) and the sections: At a glance, Posts per day, Channels, Top posts and Link in bio. Add a short note for the top, for example what you plan next month.
Make it or schedule it
Press Make it now and open to see it at once, or set a weekly or monthly email with the day and hour and the people who get it.
Share it
Copy the share link for a chat message, or let the email go out. Each email has a link to stop getting it.
Example: an agency's monthly report for a dentist
An agency runs Facebook, Instagram and Google Business Profile for a dental clinic. It creates a report called "Clinic monthly", picks the clinic as the customer, 30 days and all 5 sections, and writes a note at the top: "Next month we focus on the new teeth whitening offer." The report is emailed on the 1st of every month at 09:00 to the clinic owner and the practice manager. The owner opens the link on her phone and, before the quarterly meeting, saves 3 months of reports as PDFs from the same link.
What each section shows
At a glance counts the posts published in the period, clicks on your short links, the posts scheduled next and the posts that needed a fix. Posts per day is a simple chart of when posts went out. Channels lists each channel with the numbers its network shares, such as followers, reach, views or likes, and the change against the period before. Top posts are the posts with the most likes, comments and shares. Link in bio adds the views and clicks of your link pages.
Charts are drawn on the page itself, so they print sharply and need no extra app. When a period has no posts, the report says so instead of drawing an empty chart.
Why reports keep their own numbers
Every time a report is made, by hand or on schedule, Postozo stores a copy of the numbers with it. The share link always opens the newest copy, and each email links to the exact copy it was sent with. So a client who opens last month's email in 3 weeks sees last month's numbers, not today's. It also means a report opens fast and never waits for a network, which matters because networks limit how often apps may ask for statistics.
Branding, privacy and replies
On Pro and Ultimate, white label puts your agency name, logo and colour on the report, the share page and the emails, and replies go to your own support address. Without white label, replies go to the person who made the report. Report pages are not listed by search engines. Practice channels are marked as made up numbers, so a demo report is never mistaken for a real one.
Limits and rules
| Periods | 7, 30 or 90 days |
| Sections | At a glance, Posts per day, Channels, Top posts, Link in bio |
| Email schedule | Weekly or monthly, at an hour you pick in the report's time zone |
| People per report | Up to 10 email addresses |
| Saved from the browser, laid out for A4 | |
| Search engines | Report pages are not listed |
Writing the note that goes on top
The note is what turns numbers into a report. Keep it to 3 lines: what you did this period, what worked, and what you will do next. For example: "We posted 18 times, mostly short videos. The Diwali offer post was the best of the year on Instagram. Next month we try 2 posts a week on LinkedIn for the office catering service." Clients read the note first, so write it for someone who will not open the charts.
Reports and analytics, side by side
Analytics is for you: live numbers, any channel, any day. Reports are for someone else: a fixed set of channels, a fixed period, a copy of the numbers that does not change, and a page that opens without an account. Use analytics to decide, and reports to show.
Tips to get more from it
- Write the note at the top before each send. 2 lines about what you will do next makes the numbers useful.
- Pick 30 days for monthly emails and 7 days for weekly ones, so the periods do not overlap.
- Make a new link if a report link reached the wrong person. The old link stops working at once.
Words on this page, explained
| Period | The days a report covers: 7, 30 or 90. |
| Run | 1 made report, with its own copy of the numbers. |
| Share link | A link that always opens the newest run of a report. |
Mistakes to avoid
- Sending a report before the first posts have numbers. New posts can take 1 to 2 days to show statistics on some networks.
- Picking channels by hand for a client who adds channels often. Leave the list empty to include every channel of the customer.
- Forwarding the share link widely. Anyone with the link can open the report, so make a new link if it was sent to the wrong person.
Who it is for
- Agencies stop building reports by hand at the end of every month. See Agencies.
- Marketing teams send the same numbers to managers every week without a spreadsheet. See Marketing teams.
- Business owners who work with a freelancer see what was posted and what it did. See Small business.
How other tools handle client reports
Of the 12 social media tools we compare, 11 list client reports on their own pricing, feature or help pages:
- Buffer: Reports on Essentials and Team; branded reports on Team only.
- Hootsuite: Custom reports you can schedule and export, Professional and up.
- Later: Share an Instagram analytics report through a link.
- Sprout Social: Presentation-ready reports shared by link, Professional and up.
- Metricool: PDF and PPT reports with monthly automatic sending on paid plans; custom templates on Advanced and up.
- SocialPilot: PDF and scheduled reports from Standard; white-label reports on Premium and up.
- Publer: Downloadable analytics reports, Business and up.
- Sendible: PDF reports and scheduled report emails on every plan; custom branding on Premium and up.
- Vista Social: Download and schedule reports on every plan.
- Planable: Custom reports in the paid Analytics add-on.
- Agorapulse: PDF or CSV export with your logo and colors on every plan; automatic report emails on Advanced and up.
Not confirmed on their own pages: Postiz.
Plans and limits
Client reports are in every plan. Your own brand on them comes with white label on Pro and Ultimate. See Pricing for every limit.
| Limit | Standard | Team | Pro | Ultimate |
|---|---|---|---|---|
| Client reports | Yes | Yes | Yes | Yes |
| Weekly or monthly emails | Yes | Yes | Yes | Yes |
| Your brand on reports | No | No | Yes | Yes |
Works with these channels
Client reports works on every connected channel. These are the ones people use it with most:
See all channels, or compare Postozo with other tools on the compare page.
Questions
Does the client need an account to read a report?
No. The share link and the emails open the report in any browser.
Can I make a PDF?
Yes. Open the report and press Save as PDF. Your browser saves it, so it works in every language.
Which numbers are in a report?
Posts published, link clicks, posts scheduled next and posts that needed a fix, plus each channel's numbers from the network and the posts with the most likes, comments and shares.
Can a client stop the emails?
Yes. Every email has its own link to stop getting it.
What should a social media report include?
What was posted, how each channel did compared with the period before, the posts that did best, and what comes next. Postozo builds the first 3 for you and leaves room for a note.
How often should I send a social media report?
Monthly for most clients, weekly when a campaign is running. Set the report to send itself and it goes out on time.
Are the numbers in reports real?
Yes. They come from each network. Practice channels are marked as made up numbers on the report.
Related features
Analytics
Follow results for each channel and each post, count clicks on your links, and find the best time to post.
Read moreClient approval
Turn on approval for a customer and every post for them waits for a yes. Clients approve, ask for changes or comment from a simple review link.
Read moreLink in bio
Make a small page with all your links for your Instagram, TikTok or X bio. It shows your latest posts with pictures and counts views and clicks, without tracking scripts.
Read moreTeam and roles
Invite your team and clients to 1 workspace. Each role sees and does only what it should.
Read moreStart planning your posts today
Create your account and publish your first post in 5 minutes.
Create your free account